Oracle Data Visualization Desktop (DVD) has been released and now all the BI Bloggers including myself who did not get a beta copy are scrambling to review and post their thoughts.
The functionality of Data Visualization is not new the Business Analytic tools offered by Oracle. OBIEE 12c and BI Cloud Services (BICS) have Visual Analyzer Projects and then there is Data Visualization Cloud Service (DVCS). But Data Visualization Desktop (DVD) is Oracle's truly first direct to any data source desktop tool since the days of Interactive Reporting.
Now full disclosure, I am a true fan of Interactive Reporting. I cut my business intelligence teeth on Brio 6.0 back almost 18 years ago. I really like Interactive Reporting. It provided direct access to almost any database via ODBC and could import local data files. You had graphical data modeling, query and analysis and dashboards along with paginated reporting. All in All it was and I argue still is a great tool. But in the age of acquisitions Oracle made a decision to take its acquisition of Siebel Analytics and make it the new face of Oracle Business Intelligence Enterprise Edition. Unfortunately, Interactive Reporting which came along a few months later with the acquisition of Hyperion became the "Redheaded Stepchild" and was relegated to "Not a Strategic Product" along with SQR and Web Analysis.
Alright…enough of nostalgia lane!The Desktop install comes with two sample datasets and sample Visual Analyzer Project to showcase some of the features and capabilities.
The part the interested me the most was direct to data access.
The Data Sources panel provides access to existing Data Sources, capabilities to create new data sources and manage connections.
Clicking Create New Data Source brings up the following dialog.

From a File is self explanatory and nice way to include non-curated data in an analysis.
From Oracle Applications is interesting, if you read the print below the option you see
"Select an Analysis containing the data you want to visualize."
Looking at this Option I see that I can connect to an existing OBIEE instance.

After setting connection information and Signing in I see the OBIEE catalog I have access to
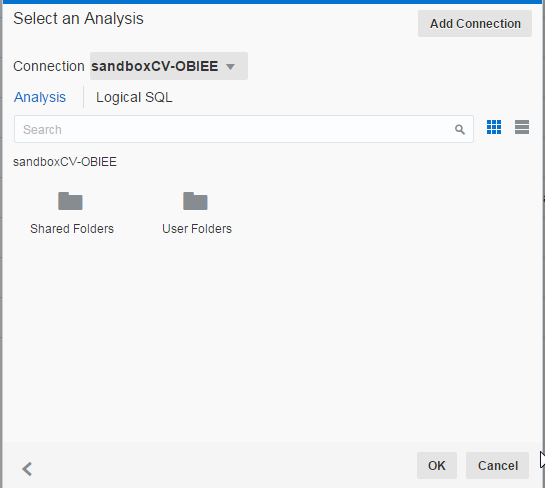
Navigating to an analysis

Reviewing and retrieving the data from the analysis


My Data Source in a Visual Analyzer Project

The option to create data source from Database provides access to a large number of databases

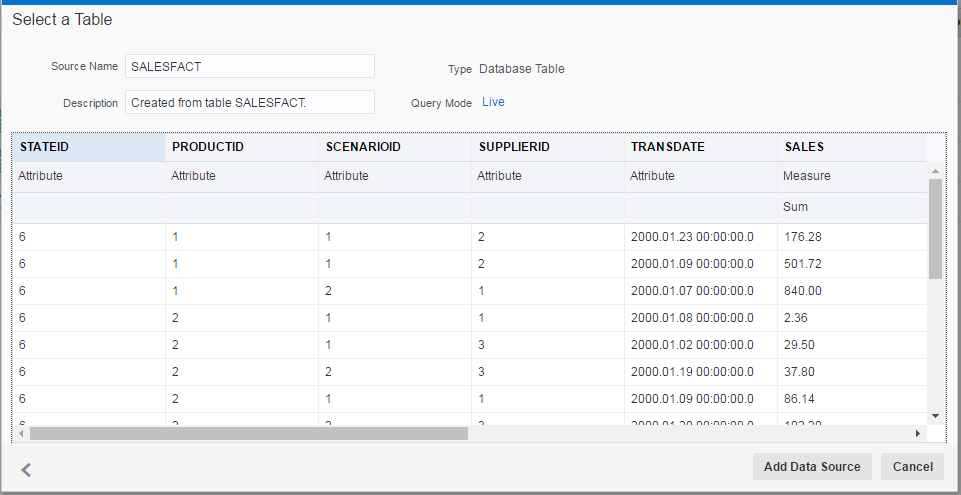
Connecting to the database I can see the tables

Selected table is displayed and the columns can be inspected.
The data source is imported into DVD and is available for building a VA Project.

To add more data sources you can add in the Data Sources interface or you can add within the Visual Analyzer Project.

Adding requires you to go through the steps of creating a data source, picking a data source type and if the database already has connection then selecting the table.
When the data source is added from within VA Project a wizard drives how that table will be used - Extend a Fact or Extend a Dimension. If Extend a Dimension then the matching column is established.

Looking at the Source Diagram the relationship link is displayed.

Dimensions can be extended as well.

And when additional supporting dimensions are added and a complete model is built for the project the relationships of the data sources is more evident.

Now the diagram may be a bit confusing with some thinking that there are joins between all the tables but if you look closely you see the darker lines with numeric value showing actual joins.
So, my first impressions are that it is an easy tool to navigate and get into data analysis rather quickly. I like that I can create multiple data sources from many different sources and add them into a VA Project.
I would like to see the ability to add more than one data source at a time.
There will be many more blog posts by others in the weeks to follow and I look forward to their impressions.
Comments
Post a Comment